Editorial Disclaimer
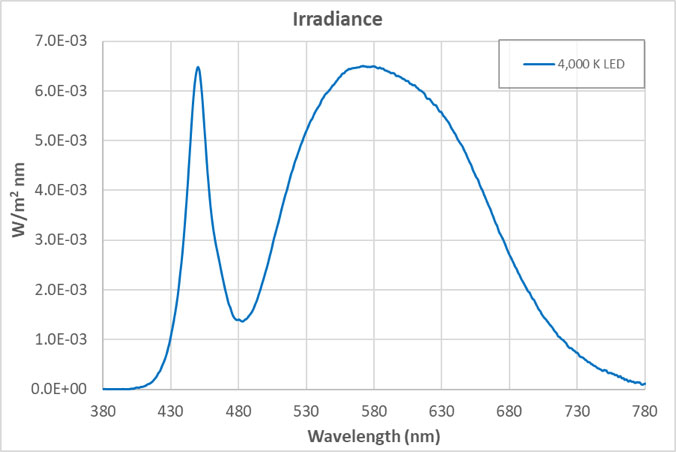
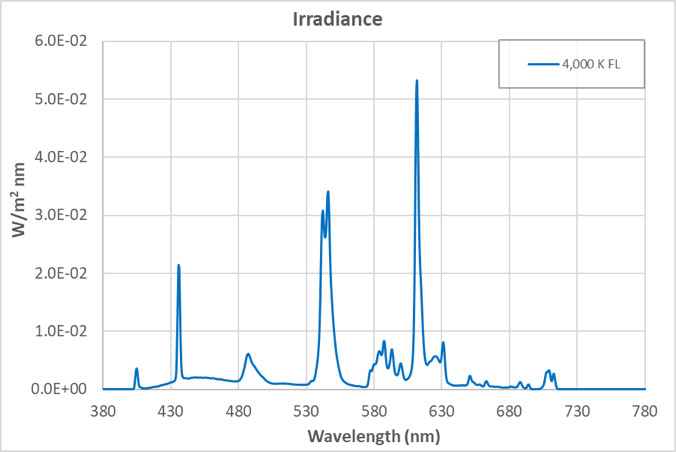
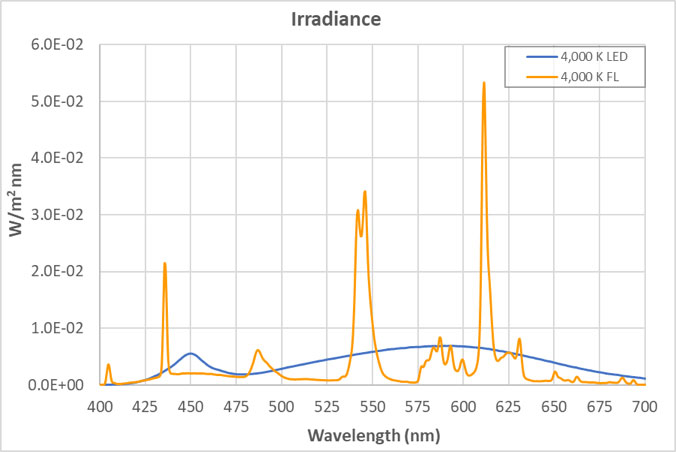
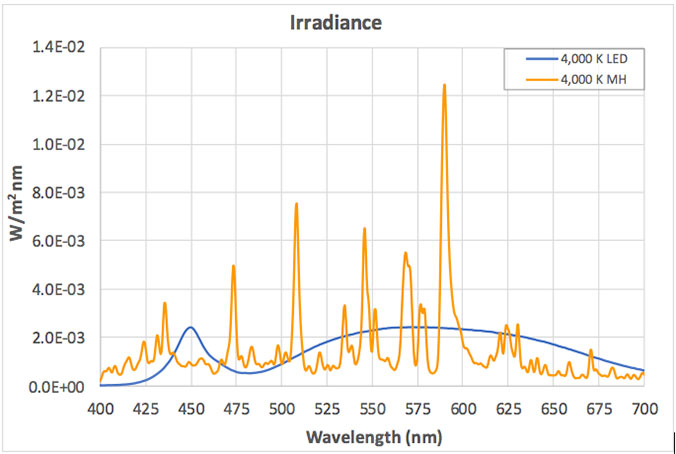
The views expressed in articles published on FIRES do not necessarily reflect those of IES or represent endorsement by the IES. By Eric Bretschneider, Ph.D How often do we hear about the dangers of blue light from LEDs? Such discussions inevitably include statements about “the intense blue peak” in LED lighting and the potential for damage from the massive amounts of blue light present in LED lighting. The whole argument sounds plausible enough when we look at the spectrum of a typical white LED. The spectrum below is for a typical white LED with a CCT of 4,000 K at levels that approximate a typical commercial or retail environment (400 lux). The isolated peak in the blue clearly stands out, but does it really represent a massive dose of blue light? In an effort to answer this question, let’s look at fluorescent lighting. Below is the spectrum of a typical 4,000 K fluorescent lamp, equivalent to 400 lux. A quick look confirms it: fluorescent light appears to have a fraction of the blue content of the LED. But wait a minute, you recall that I said both of these sources represented the same light level – 400 lux. Have we missed something? Indeed we have. When the data is plotted on the same graph, perhaps our concerns about the “intense blue peak” of LED lighting were misplaced (or at least mis-scaled). Suddenly we begin to question why are we only hearing about “intense peaks” for LED lighting? Where are the concerns about an alternative lighting technology that we have been exposed to for decades? Although the spectrum of an HID lamp is significantly different than that of a fluorescent lamp, it doesn’t change the situation. Below is a comparison of the emission spectra of an LED vs MH (metal halide). Light levels correspond to 150 lux, which approximates the lighting in a warehouse. Again, I have to question concerns about the “blue peak” when it comes to LEDs while nothing is said about “blue peaks” in relation to MH lighting. What is often missed is that the total energy in a wavelength band is more critical than the height of the spectral peak. Specifically, it is the area under the curve (width x height) that we should be more concerned about. For example, if you define “blue content” as the fraction of light between 400 nm and 490 nm compared to light between 400 nm and 700 nm, then for the sources above, the blue content of the LED is 16.6%, the fluorescent is 18.4%, and the HID is 24.0%. Now let’s try to tackle the real reason for this post – the total amount of blue light we are exposed to from LEDs. Our visual system is adapted to withstand exposure to sunlight for about 10 hours/day, every day for roughly 70-80 years. Below is the comparison between indirect sunlight (10,000 lux) and commercial/retail lighting (400 lux). Notice the blue squiggle at the bottom? In the range of 400 nm to 490 nm, indirect sunlight exposes us to 27 times as much blue light as LEDs at typical indoor lighting levels. 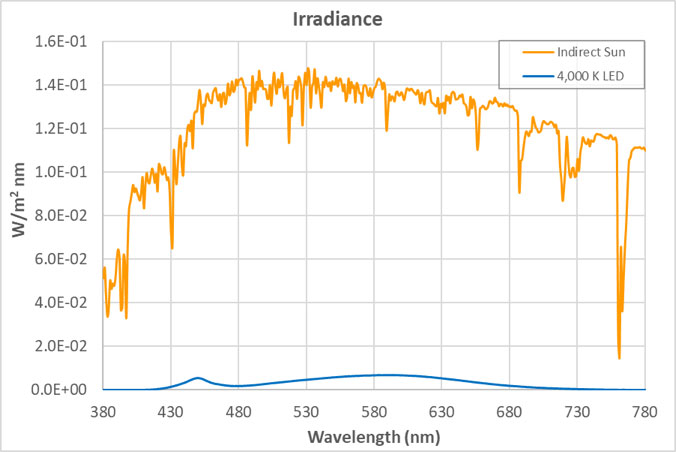 Direct sunlight can be up to about 100,000 lux, a full order of magnitude greater than what is shown above. At this level of lighting, the LED spectrum would be squashed to a line at the bottom of the plot. Given our typical exposures to daylight and electric light, our exposure to blue light has not been increased using LED lighting. The discussions of circadian impact are completely different, being related to wavelength of exposure, not flux. I contend that those who insist that the “massive doses of blue light” present in LED lighting are harming our health are misinformed. There are also issues with respect to the wavelength dependence of certain effects, including the melanopsin action spectrum, the retinal thermal hazard function and the blue light hazard function. It is noted that in general, the potential for damage increases as wavelength decreases. Further discussion on these topics is beyond the scope and intent of this article. |  |LED盘
( 粤ICP备18067418号 )
 <
<





 发表于 2019-12-8 22:01:44
